Global climate graphs
Last updated: 15/11/2023
Download this resource for free
Create an account to access thousands of teacher-created PDFs.
No payment required!
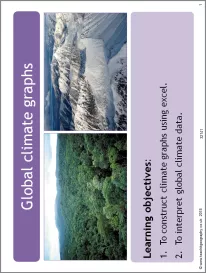
A geography skills resource instructing students on how to create climate graphs using Excel. Students use climate data to create four graphs for four differing global locations. They then complete questions describing, comparing and contrasting these graphs.
The resource includes clear, step-by-step instructions, as well as the data required for completing the graphs. Students are also provided with structured questions to help them analyse the graphs, and an extension task to challenge them.
All reviews
Have you used this resource?
Review this resource27/08/2020
28/04/2020
28/04/2020
